****JavaScript web menu drop down DHTML menu generated by NavStudio. (OpenCube Inc. - http://www.opencube.com)****
|
|
|
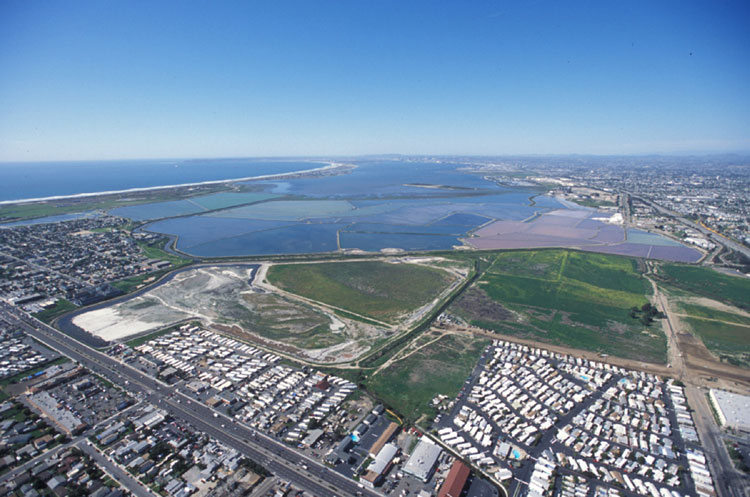
THE SOUTH BAY, in particular, is one of the most valuable and productive regions of San Diego Bay . South San Diego Bay contains 84 percent of San Diego 's remaining 76 acres of wetlands . It is estimated the South Bay has approximately 200 acres of intertidal salt marsh and over 600 acres of intertidal sand and mudflats (MacDonald et al., 1990). The salt ponds of South Bay provide irreplaceable habitat for many bird species. Each year, these birds use the ponds to nest, feed, and roost. 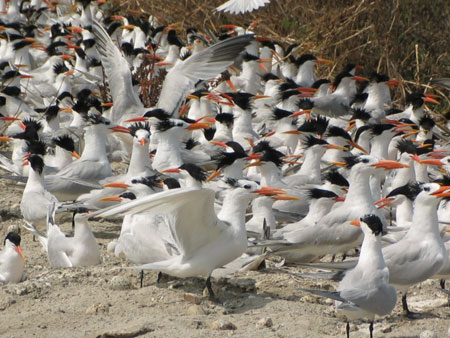 It is one of the few large areas remaining along the highly urbanized southern California Coast where large populations can gather. It is estimated that the salt ponds are used by 522,553 birds including 312,000 shorebirds, 70,000 waterfowl, and 64,000 seabirds (Friends of South Bay Wildlife, 1995). It is one of the few large areas remaining along the highly urbanized southern California Coast where large populations can gather. It is estimated that the salt ponds are used by 522,553 birds including 312,000 shorebirds, 70,000 waterfowl, and 64,000 seabirds (Friends of South Bay Wildlife, 1995).
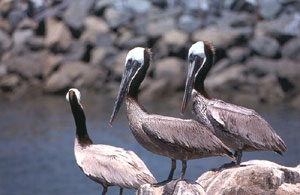
The open water also provides critical wintering habitat for migratory waterfowl. In the winter, South Bay is heavily used by migrating and wintering birds including: 79,000 waterfowl such as surf scoters and scaup; 10,000 seabirds (such as gulls and terns); and populations of brown pelicans and brant geese. The large number of bird species represents over 40% of all shorebird activity in the county and there are nesting grounds for 13 bird species, many which are endangered. Threatened and endangered birds that frequent South Bay include the California least tern, snowy plover, brown pelican, light-footed clapper rail, and Belding's savannah sparrow. A group of green sea turtles also lives in some of the southernmost areas of the Bay (Friends of South Bay Wildlife, 1995). While it is too late to restore the bay to its original abundance, we can preserve what is left. Photo courtesy of Unified Port District of San Diego Present Condition of the Bay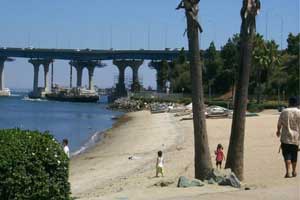 Over the past 100 years, development and urbanization of the Bay have caused many changes and impacts to the natural and economic resources of the San Diego Bay watershed. Like most bays and harbors located near large urban centers, the health of San Diego Bay has been substantially affected by human activities. Starting in the early 1900s, sharp population growth and rapid industrial development occurred within the San Diego Bay region. This development generated increasing amounts of domestic and industrial wastes. Over the past 100 years, development and urbanization of the Bay have caused many changes and impacts to the natural and economic resources of the San Diego Bay watershed. Like most bays and harbors located near large urban centers, the health of San Diego Bay has been substantially affected by human activities. Starting in the early 1900s, sharp population growth and rapid industrial development occurred within the San Diego Bay region. This development generated increasing amounts of domestic and industrial wastes.
Photo courtesy of Unified Port District of San Diego Prior to development, approximately seven creeks and river tributaries provided freshwater flows into the Bay. In 1853, the “Derby Dike” created a permanent diversion of the San Diego River into Mission Bay rather than into San Diego Bay , thus eliminating a large source of freshwater for San Diego Bay. Since that time, freshwater flows into the Bay have been further cut by upstream dam construction, extensive use of ground water, and natural periods of drought. Currently, freshwater sources into the Bay are limited to periodic drainage from land and seasonal flows (during times of rainfall) from still existing streams and creeks such as Paradise, Chollas, Paleta, Switzer, and Sweetwater (SAIC, 1998). In addition, discharges and spills from municipal, commercial, and military activities; dredging and filling operations; ongoing, permitted waste discharges; and storm water and other non-point source runoff from the large surrounding drainage region (watershed) have further degraded and impacted the water quality of the Bay. Up until the 1960s, systems for collecting and treating raw sewage and other wastes before discharge to the Bay were not used or were ineffective. As a result, domestic sewage and industrial waste containing a variety of metals, solvents, waste oil, and paints were discharged directly into the Bay (San Diego Unified Port District, 1995).
 The present condition of San Diego Bay can be characterized from the results of the recent Bay Protection and Toxic Hot Spots Program conducted during 1992 through 1994 by the California State Water Resources Board (Fairey et al., 1997). Sampling was conducted at 350 stations representing 183 sites in the Bay region (including Mission Bay, San Diego River Estuary, and Tijuana River Estuary). The study used measurement of chemical contaminants in sediments, evaluations of bottom-dwelling organisms, and laboratory toxicity tests to define the health of multiple indicators of environmental health, and increase confidence in the conclusions. This program is important because it provides the first comprehensive study of the severity of impacts and the occurrence of biological effects in San Diego Bay. The present condition of San Diego Bay can be characterized from the results of the recent Bay Protection and Toxic Hot Spots Program conducted during 1992 through 1994 by the California State Water Resources Board (Fairey et al., 1997). Sampling was conducted at 350 stations representing 183 sites in the Bay region (including Mission Bay, San Diego River Estuary, and Tijuana River Estuary). The study used measurement of chemical contaminants in sediments, evaluations of bottom-dwelling organisms, and laboratory toxicity tests to define the health of multiple indicators of environmental health, and increase confidence in the conclusions. This program is important because it provides the first comprehensive study of the severity of impacts and the occurrence of biological effects in San Diego Bay.
Photo courtesy of Unified Port District of San Diego << Previous page Next page >> |
|