****JavaScript web menu drop down DHTML menu generated by NavStudio. (OpenCube Inc. - http://www.opencube.com)****
|
|
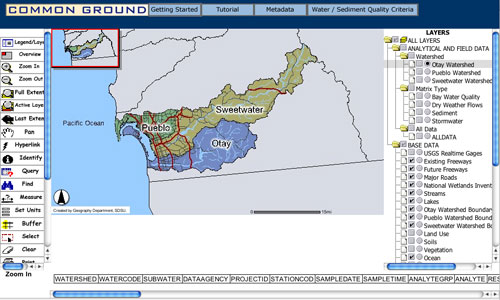
Getting Started with Maps and Mapping ToolsThe Maps main page gives you access to five kinds of maps, listed in the right side of the middle of the page, circled below. The Interactive Mapping ToolThe Interactive Mapping Tool is a powerful online mapping tool that allows you to query and access data using an interactive map. After clicking the map tool and agreeing to the Disclaimer, you will see three main columns: the Toolbar, the Map Window, and the Datasets.
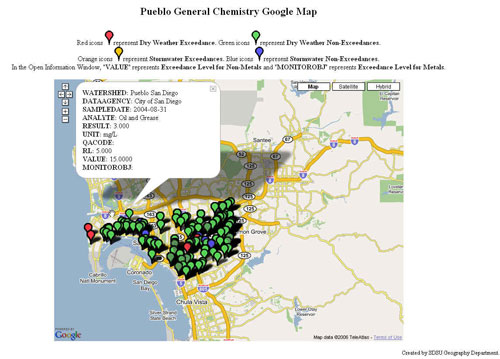
The Map Window is in the middle of the page and shows the results of using the Toolbar and the Datasets. Along the bottom of the Map Window are the field headings for the results of the Query Tool. The Toolbar is located to the left of the Map Window and contains functions to navigate and manipulate data within the Map Window. Tool help, help on column alignment, and the field heading key are available by scrolling down the Toolbar. The Datasets are located in the scroll-down window to the right of the Map Window, and can be activated by selecting the circle and square buttons to the right of the specific dataset. There is a Key section below the Datasets, which details the functions and icon meanings found within the Datasets. The ArcIMS complete tutorial is located at the top of the page. This comprehensive tutorial outlines how to use all the functions of the Interactive Mapping Tool. Also along the top of the page is the Getting Started link for the Maps main page, a link to the metadata (descriptions of the different data and how the data was collected), and a link to the sediment and water quality criteria for the San Diego Bay watersheds. Exceedance MapsExceedance Maps show when a parameter measured (such as heavy metals) exceeds the Maximum Contamination Limit set by the State Water Resources Control Board. On the Exceedance Maps, which are separated by watershed and parameter measured, a red point indicates an exceedance of the water quality standard on the date that parameter was measured. Hovering over a point will give more information on the measurement at that point. Below is the Pueblo Watershed General Chemistry Map.
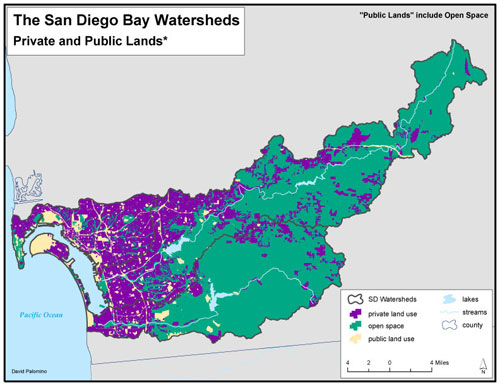
Watershed MapsWatershed Maps are static maps, or maps that do not change when you click on them, that are easy to download and print out. Land use, population and watershed maps are available in both jpg and pdf format. Below is an example of the land use map available for download.
Discourse MapsDiscourse Maps are predominantly for water quality professionals and are used to discuss online water quality issues using maps. Google Earth MapsGoogle Earth Maps allow the viewing of the maps in a 3D format. After downloading Google Earth, you may zoom in on an area, visualizing the locations of the monitoring sites in your watershed. More information on using the Maps and Mapping Tools can be found on the Tutorials on the left hand side of the main Maps page. |
|