****JavaScript web menu drop down DHTML menu generated by NavStudio. (OpenCube Inc. - http://www.opencube.com)****
|
|
Getting Started with the Data PageOn the data page at www.sdbay.sdsu.edu/data/index.php, there are two principal tools that are available, The Data Query Tool and GIS Shapefiles and Metadata. These tools appear as clickable icons in the center of the page. 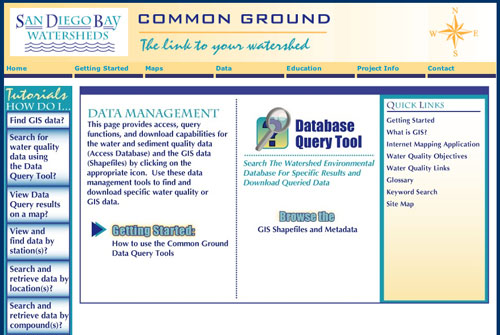
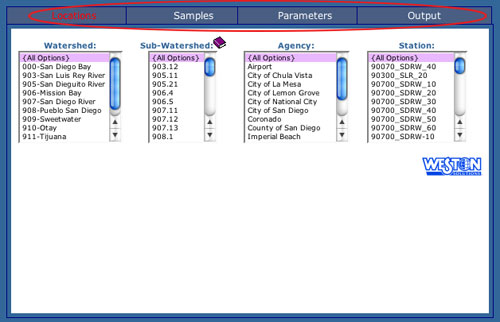
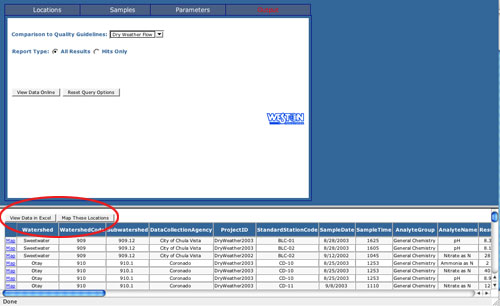
The Database Query ToolThe Database Query Tool allows the selection of water sampling results based on the parameter being tested, location of sample, watershed in which sample(s) were collected. Data can be queried by first agreeing to the Disclaimer which appears immediately after clicking the "Data Query Tool” icon located in the middle of the Data homepage. A table will appear with Locations, Samples, Parameters and Output buttons along the top row. Clicking each button will open a new selection of criteria lists. The button text will turn red when selected. If you are unsure about the definitions of the criteria, clicking the purple books in the corner of each of the criteria will open a page with more information. The example below is opened to the Locations page. Select relevant criteria from each of the three headings—Locations, Samples, and Parameters—then click Output and then, View Data Online to view your selection. For the best results, select only a few parameters, such as one location and one analyte. Selecting criteria which do not have results will result in the message, 'There are no results for the selected criteria' being displayed.
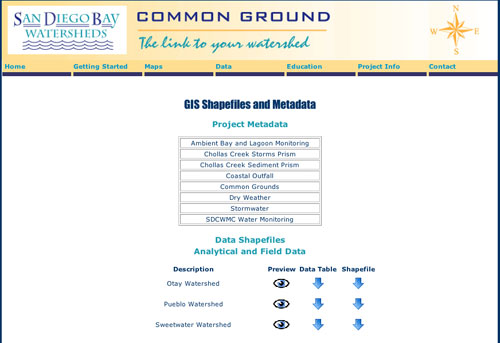
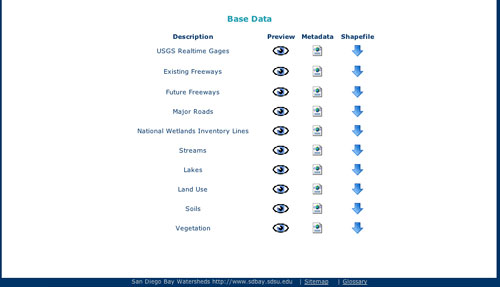
GIS Shapefiles and MetadataAt the top of the GIS Shapefiles and Metadata page are links to the metadata available, by the group that collected it. Metadata is information that describes the content, quality, condition, origin, and other characteristics of data or other pieces of information. Under the heading Analytical and Field Data is a list of the description of the available data with columns of three icons to the right. With these icons, you can access a preview map, the water quality and/or sediment data or shapefile data. Shapefiles are a vector data storage format for storing the location, shape, and attributes of geographic features in a Geographic Information System (GIS). Clicking the eye, under Preview in the first row, will open up a map indicating where the data was collected. Clicking the either arrow, under Data Table or Shapefile will open a zip file with the complete data to be saved to your computer. The bottom of the page, shown by the screen shot below, has the Base Data, including the links to download a preview, the metadata and shapefiles. More information on accessing and querying the data can be found on the Tutorials on the left hand side of the main data page. |
|