****JavaScript web menu drop down DHTML menu generated by NavStudio. (OpenCube Inc. - http://www.opencube.com)****
|
|
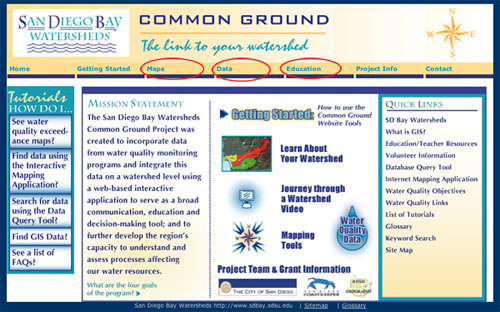
Getting StartedAt http://www.sdbay.sdsu.edu/, there are three principal tools that are available as a part of this site, Maps, Data and Education. These tools appear as clickable buttons along the top of the page immediately beneath the Common Ground logo:
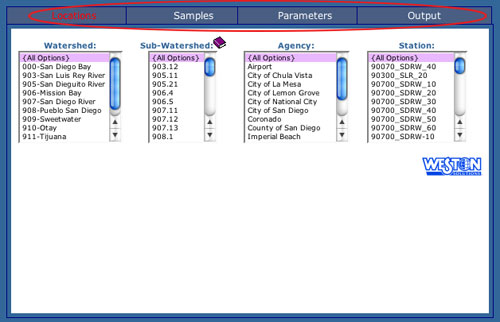
The Education ToolThe Education Tool includes regional history, educator tools and watershed science information:http://www.sdbay.sdsu.edu/education/index.php The Database Query ToolThe Database Query Tool allows the selection of water sampling results based on the parameter being tested, location of sample, watershed in which sample(s) were collected:http://www.sdbay.sdsu.edu/data/index.php Data can be queried by first agreeing to the Disclaimer which appears immediately after clicking the "Data” button located at the top of the Common Ground homepage. A table will appear with Locations, Samples, Parameters and Output buttons along the top row. Clicking each button will open a new selection of criteria lists. The example below is opened to the Locations page.
Select relevant criteria from each of the three headings—Locations, Samples, and Parameters—then click Output and then, View Data Online to view your selection. If you are unsure about the definitions of the criteria, clicking the purple books in the corner of each of the criteria will open a page with more information. The Interactive Map Toolhttp://www.sdbay.sdsu.edu/maps/index.phpAfter clicking the map tool and agreeing to the Disclaimer, you will see three main columns: the Toolbar, the Map Window, and the Datasets. 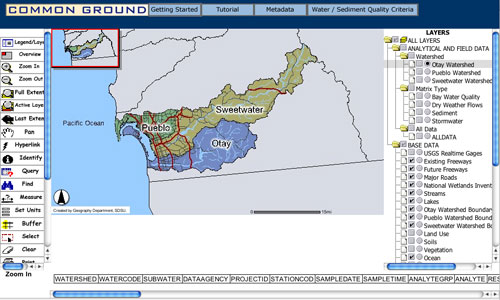
The Map Window is in the middle of the page and shows the results of using the Toolbar and the Datasets. Along the bottom of the Map Window are the field headings for the results of the Query Tool. The Toolbar is located to the left of the Map Window and contains functions to navigate and manipulate data within the Map Window. Tool help, help on column alignment, and the field heading key are available by scrolling down the Toolbar. The Datasets are located in the scroll-down window to the right of the Map Window, and can be activated by selecting the circle and square buttons to the right of the specific dataset. There is a Key section below the Datasets, which details the functions and icon meanings found within the Datasets. The ArcIMS complete tutorial is located at the top of the page. This comprehensive tutorial outlines how to use all the functions of the Interactive Mapping Tool. Also along the top of the page is the Getting Started link for the Maps main page, a link to the metadata (descriptions of the different data and how the data was collected), and a link to the sediment and water quality criteria for the San Diego Bay watersheds. If you need more assistance using the Common Ground website, use the “Tutorials How Do I…” section located on the left of each of the Common Ground main, maps and data pages. Pick a question and follow the step-by-step instructions to learn more about the functionality of the Common Ground website. The Getting Started Maps and Getting Started Data pages give an overview more specific to each of each of these sections. |
|